Region

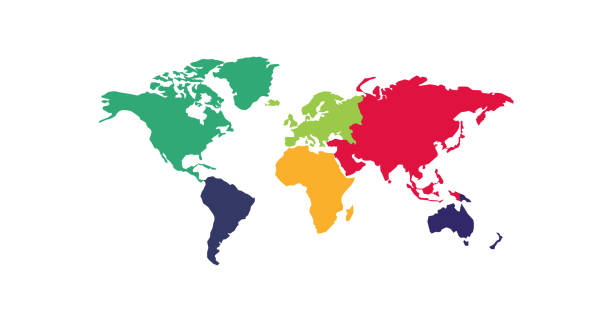
This page looks at how region affects education in different areas of the world.
Region vs Digital Connectivity
Description of Graph and Insights
This graph correlates digital connectivity values to a color value. Lower percentages are yellow, while higher percentages are blue. This data was gathered through household surveys from 2010 to the present, using the most recent data submitted. Digital connectivity is defined as school-age children that have internet access at home. This choropleth shows how digital connectivity varies by region. Africa and South India have lower rates while South America and Europe have much higher rates.
Region vs Completion Rates
Description of Graph and Insights
This scatter plot shows completion rates. The data is divided by each country and is color-coded by region*. The data is from 2010-2020. This graph shows how completion rates vary by region*. Europe and Central Asia have pretty consistently high completion rates. Sub-Saharan Africa has the most consistently low completion rates. Latin America and the Caribbean and East Asia and the Pacific have widely varying completion rates.
Key
*Region:
EAP - East Asia and the Pacific
ECA - Europe and Central Asia
EECA - Eastern Europe and Central Asia
ESA - Eastern and Southern Africa
LAC - Latin America and the Caribbean
MENA - Middle East and North Africa
NA - North America
SA - South Asia
SSA - Sub-Saharan Africa
WCA - West and Central Africa
**Development:
The development of countries is divided into groups based on income which was measured using gross national income per capita.